This is 1 of the smaller projects from the total “Brand Monitor’ design.
This function is a query to query chart and mostly used by media analist’s. Basically you combine different searches to get to your information.
Project context
The old Chart “Brands & Topics” brought confusion to the users.
A chart to combine searches was really necessary for the users.
Mostly used by Analist’s.
Research
From the interviews with our Brand Monitor users we knew this function was very important to them. From their feedback we could make this function as simple as possible.
Challenges
The stakeholders wanted to keep ‘Brand & Topics” as the functional title. They thought it was still a good ‘branding’ title for this function.
Proces
Interview sessions with the users.
Prototyping and feedback sessions with users.
Feedback sessions with users after product release.
Design
It took several prototyping sessions with users to get to a K.I.S. design. After the product release to a group of customers we could also collect insights.
Impact
The new function made a big difference for our users. Especially the Police analist’s were very happy about this.
Details
Duration: 4 weeks
Tools: Mural, Adobe XD
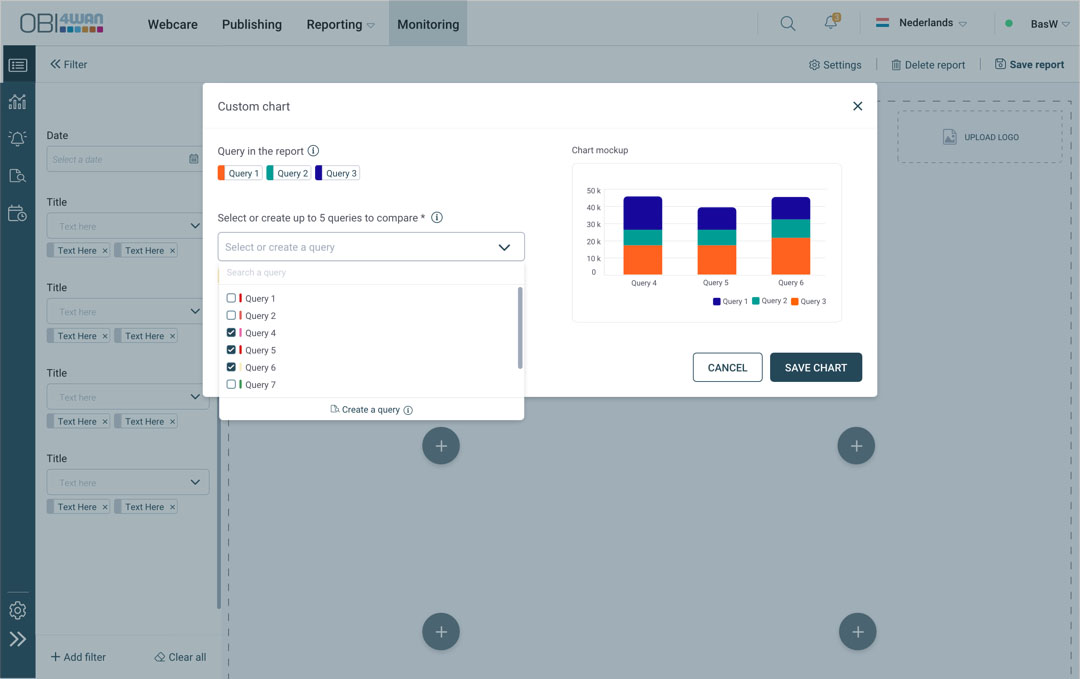
1.
The modal for selecting a chart for your report. Custum chart is there.
2
When starting the Custom Chart you select Queries and select other queries or building them to compare and get your information out of it.
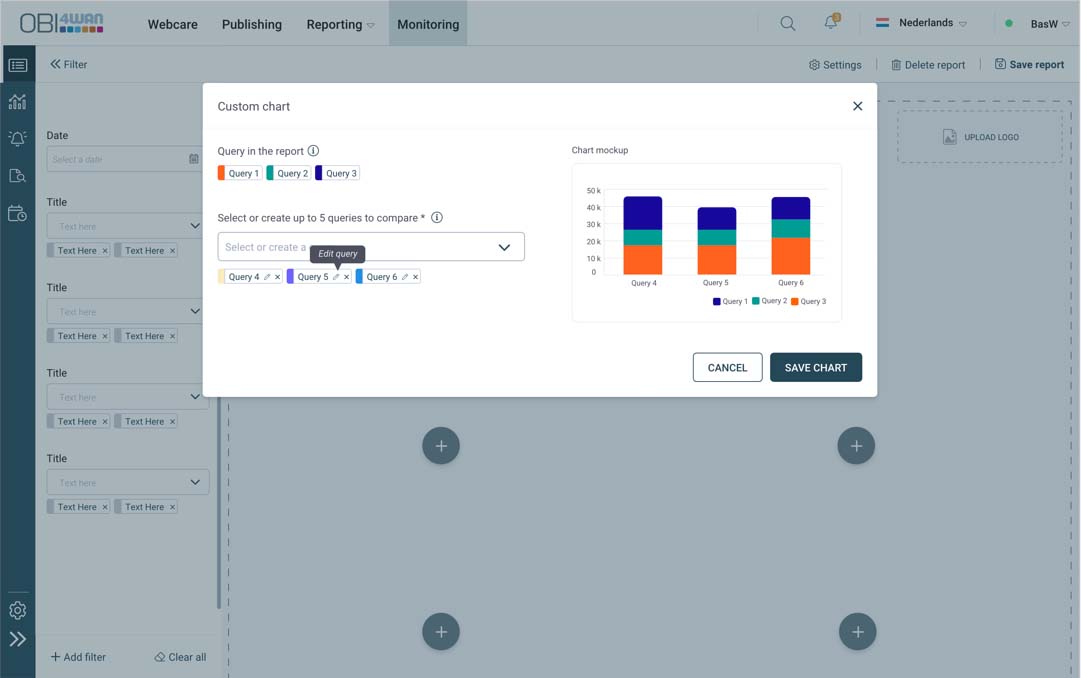
3
Now we have 3 queries (1,2,3) to compare with queries 4,5 and 6.
The chart in this modal is just a mockup.
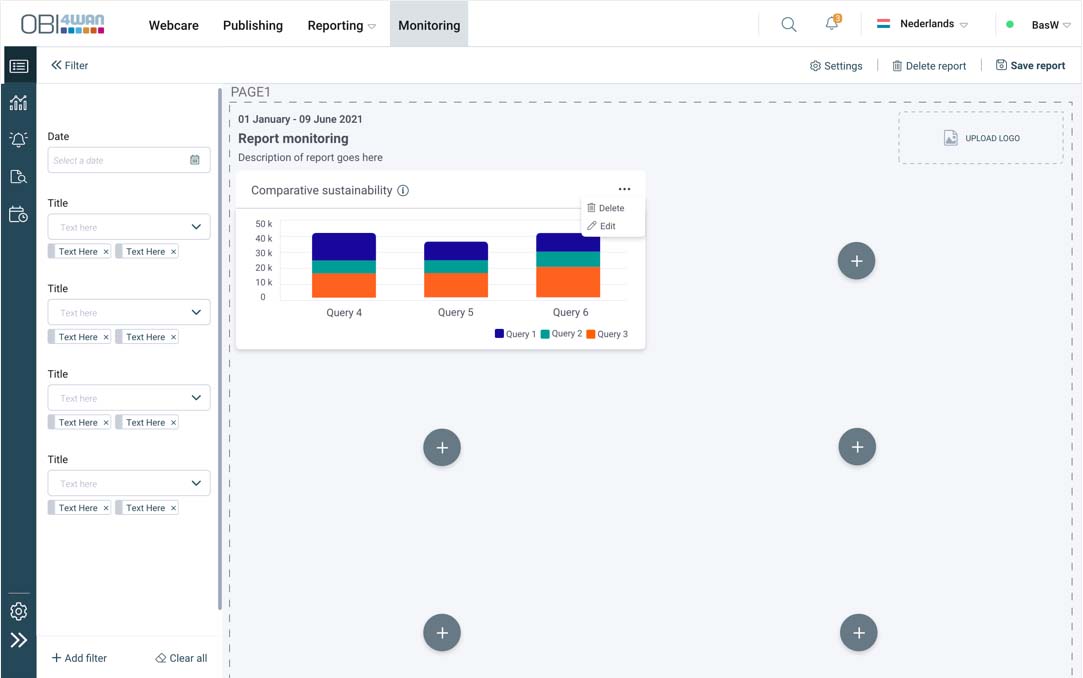
4
After saving the chart you get the real data from your input and the chart is saved to your report.